
参考文档 搭建prometheus监控的时候
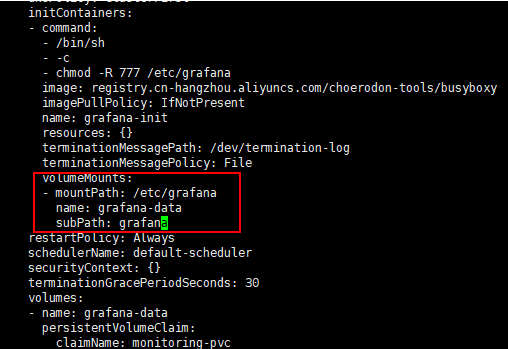
这是grafana的deployment文件的一部分,为什么这个volumeMounts没有数据到nfs持久化存储里面,这个目录应该是挂载了的,已经有子目录grafana,但是没有数据,进容器里面是可以看的如下数据的
![]()
Hi, 看下 containers
使用命令查看吗?
[root@node3 mnt]# kubectl get po monitor-grafana-8486c68865-crw7k -n monitoring -o yaml
apiVersion: v1
kind: Pod
metadata:
annotations:
choerodon.io/metrics-group: grafana
choerodon.io/metrics-path: /metrics
labels:
choerodon.io/infra: grafana
choerodon.io/metrics-port: “3000”
choerodon.io/release: monitor
pod-template-hash: “4042724421”
name: monitor-grafana-8486c68865-crw7k
namespace: monitoring
ownerReferences:
- apiVersion: extensions/v1beta1
blockOwnerDeletion: true
controller: true
kind: ReplicaSet
name: monitor-grafana-8486c68865
uid: 4a5fd2d0-dbe4-11e8-a918-00163e04d384
resourceVersion: “9520681”
selfLink: /api/v1/namespaces/monitoring/pods/monitor-grafana-8486c68865-crw7k
uid: 40a5bd3d-dbea-11e8-8ba9-00163e040973
spec:
containers: - env:
- name: GF_AUTH_BASIC_ENABLED
value: “true” - name: GF_AUTH_ANONYMOUS_ENABLED
value: “false”
image: registry.cn-hangzhou.aliyuncs.com/choerodon-tools/grafana:5.1.3
imagePullPolicy: IfNotPresent
name: grafana
ports: - containerPort: 3000
name: http
protocol: TCP
resources:
limits:
cpu: 200m
memory: 864Mi
requests:
cpu: 100m
memory: 512Mi
terminationMessagePath: /dev/termination-log
terminationMessagePolicy: File
volumeMounts: - mountPath: /var/lib/grafana
name: grafana-data
subPath: grafana - mountPath: /var/run/secrets/kubernetes.io/serviceaccount
name: default-token-79jzj
readOnly: true
dnsPolicy: ClusterFirst
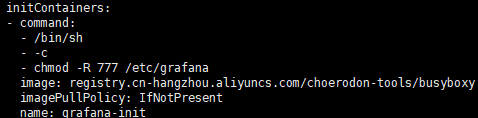
initContainers:
- name: GF_AUTH_BASIC_ENABLED
- command:
- /bin/sh
- -c
- chmod -R 777 /etc/grafana
image: registry.cn-hangzhou.aliyuncs.com/choerodon-tools/busyboxy
imagePullPolicy: IfNotPresent
name: grafana-init
resources: {}
terminationMessagePath: /dev/termination-log
terminationMessagePolicy: File
volumeMounts: - mountPath: /etc/grafana
name: grafana-data
subPath: grafana/conf - mountPath: /var/run/secrets/kubernetes.io/serviceaccount
name: default-token-79jzj
readOnly: true
nodeName: node3
restartPolicy: Always
schedulerName: default-scheduler
securityContext: {}
serviceAccount: default
serviceAccountName: default
terminationGracePeriodSeconds: 30
volumes:
- name: grafana-data
persistentVolumeClaim:
claimName: monitoring-pvc - name: default-token-79jzj
secret:
defaultMode: 420
secretName: default-token-79jzj
status:
conditions: - lastProbeTime: null
lastTransitionTime: 2018-10-30T02:19:51Z
status: “True”
type: Initialized - lastProbeTime: null
lastTransitionTime: 2018-10-30T02:19:52Z
status: “True”
type: Ready - lastProbeTime: null
lastTransitionTime: 2018-10-30T02:19:38Z
status: “True”
type: PodScheduled
containerStatuses: - containerID: docker://295c04bcc041006f58cd32b886020732ba2c5a2868e3e5766e6300a46fbdef1a
image: registry.cn-hangzhou.aliyuncs.com/choerodon-tools/grafana:5.1.3
imageID: docker-pullable://registry.cn-hangzhou.aliyuncs.com/choerodon-tools/grafana@sha256:364bec4a39ecbec744ea4270aae35f6554eb6f2047b3ee08f7b5f1134857c32c
lastState: {}
name: grafana
ready: true
restartCount: 0
state:
running:
startedAt: 2018-10-30T02:19:52Z
hostIP: 192.168.1.103
initContainerStatuses: - containerID: docker://10ed11d22c43dd2a7b5b071e3539c25eba7d41cb6851ef11da78974d9826ed4b
image: registry.cn-hangzhou.aliyuncs.com/choerodon-tools/busyboxy:latest
imageID: docker-pullable://registry.cn-hangzhou.aliyuncs.com/choerodon-tools/busyboxy@sha256:cdbe636b45107ebde0a6a6d3f2a7ba4cd8dd9719937579bace5139377f98c72f
lastState: {}
name: grafana-init
ready: true
restartCount: 0
state:
terminated:
containerID: docker://10ed11d22c43dd2a7b5b071e3539c25eba7d41cb6851ef11da78974d9826ed4b
exitCode: 0
finishedAt: 2018-10-30T02:19:50Z
reason: Completed
startedAt: 2018-10-30T02:19:50Z
phase: Running
podIP: 10.233.65.115
qosClass: Burstable
startTime: 2018-10-30T02:19:38Z
grafana.ini这个文件没有映射出来,无法修改这个文件啊,现在我想添加邮件服务器,请问有其他方法吗?
您好, 目前暂时无法直接修改, 你可以手动绑定一个新的卷或者configmap。
这个initContainers是做什么的,是不是执行完成后就没有了?
这个只是给文件夹设置权限,执行完成后就没了
使用文档上方式搭建prometheus,可以将exporter和prometheus-server端分开吗?生产环境只想安装exporter。不想安装整个prometheus
Prometheus中有一定k8s配置,在集群外的Prometheus将无法收集来自集群pod,service直接提供的指标,添加或修改数据源都需要手动修改Prometheus配置,不建议分开配置,如果你仅想部署exporter可以参考官方chart库的部署方式 如: