- Choerodon平台版本: 0.18
目前我的整体流程已经跑通了,在日志收集这块有一点疑问,我在kibana中找不到我业务应用启动容器的日志,不知道该如何添加,查了半天官网也没有具体的应用
我在部署流水线当中的资源–容器里边可以看到我当前业务启动容器的详细日志,这个日志是如何持久化的呢,是不是由elk做日志收集了,日志相关的部署我也都部署了
日志的基础组件服务也都正常

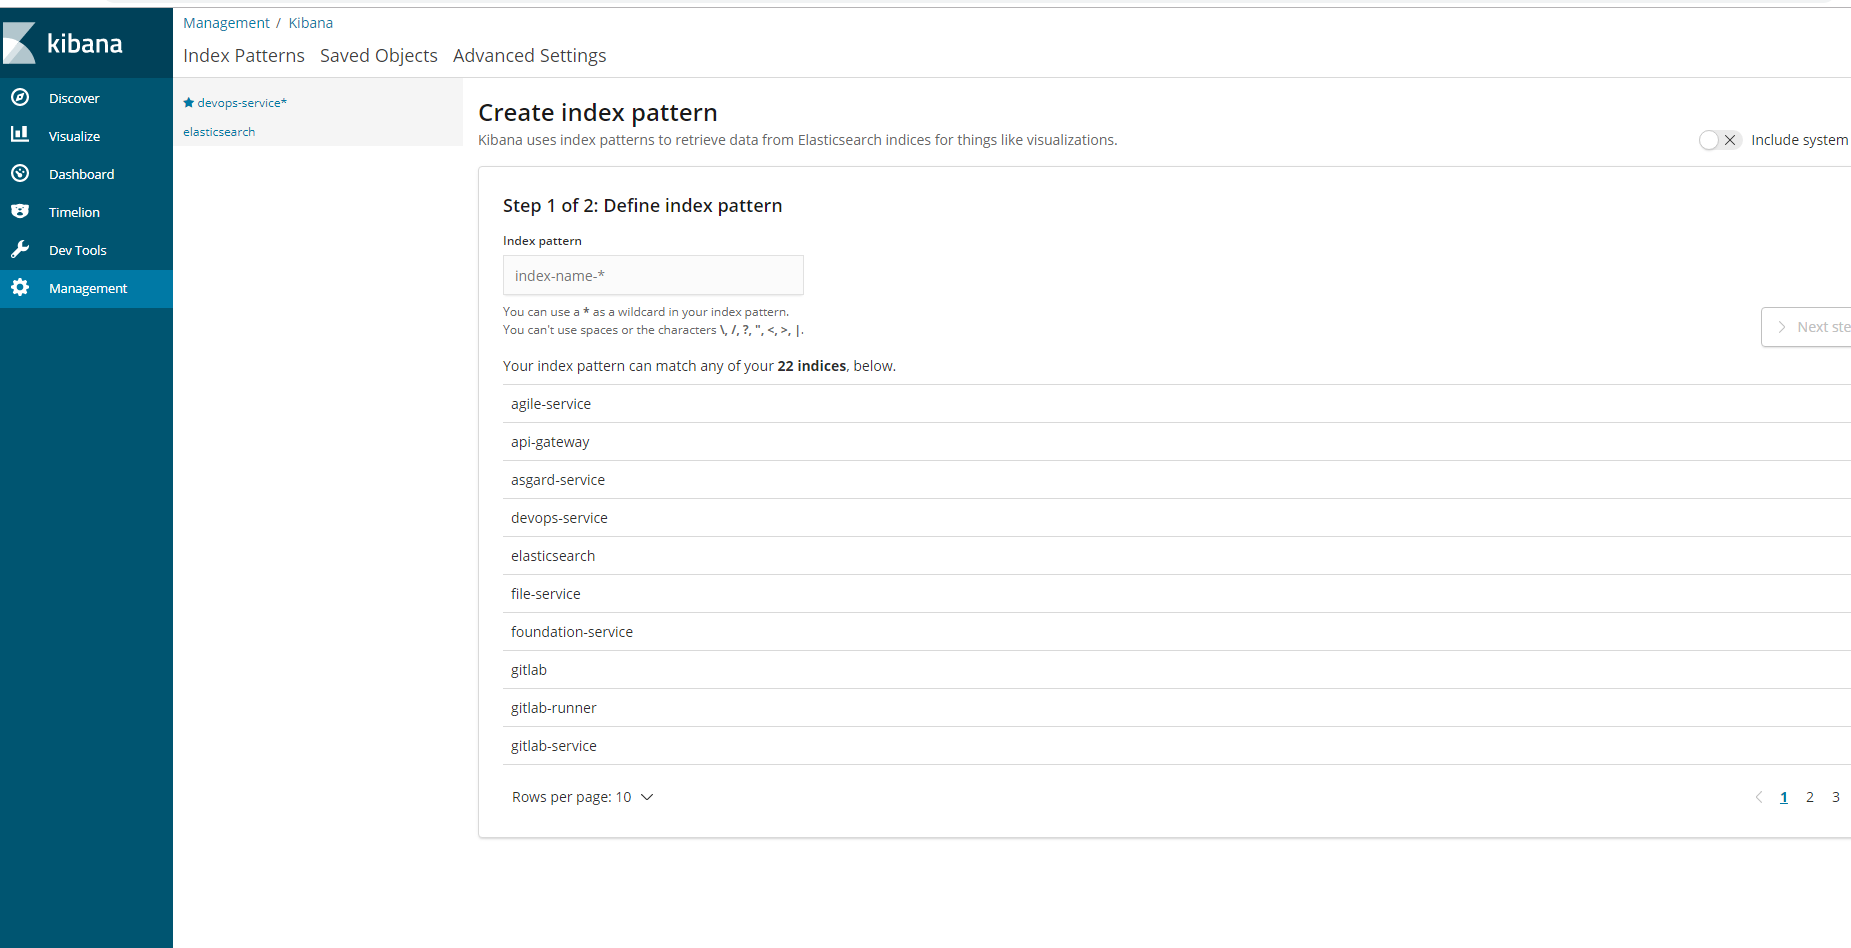
就是在kibana中如何创建我的容器日志?
这里边没有索引,应该是没有配置,哪位帮忙解答下谢谢了

我在部署流水线当中的资源–容器里边可以看到我当前业务启动容器的详细日志,这个日志是如何持久化的呢,是不是由elk做日志收集了,日志相关的部署我也都部署了
能在帮忙看看我的问题吗,我不知道是我哪里配置的不对
日志收集相关的,我配置了templates下的_helper.tpl内容如下:
{{/* vim: set filetype=mustache: */}}
{{- /*
service.labels.standard prints the standard service Helm labels.
The standard labels are frequently used in metadata.
*/ -}}

{{- define "service.microservice.labels" -}}
choerodon.io/version: {{ .Chart.Version | quote }}
choerodon.io/service: {{ .Chart.Name | quote }}
choerodon.io/metrics-port: {{ .Values.deployment.managementPort | quote }}
{{- end -}}

{{- define "service.labels.standard" -}}
choerodon.io/release: {{ .Release.Name | quote }}
{{- end -}}

{{- define "service.match.labels" -}}
choerodon.io/release: {{ .Release.Name | quote }}
{{- end -}}

{{- define "service.logging.deployment.label" -}}
choerodon.io/logs-parser: {{ .Values.logs.parser | quote }}
{{- end -}}

{{- define "service.monitoring.pod.annotations" -}}
choerodon.io/metrics-group: {{ .Values.metrics.group | quote }}
choerodon.io/metrics-path: {{ .Values.metrics.path | quote }}
{{- end -}}
还有一个是values.yaml文件中添加了如下内容:
metrics:
path: /prometheus
group: spring-boot
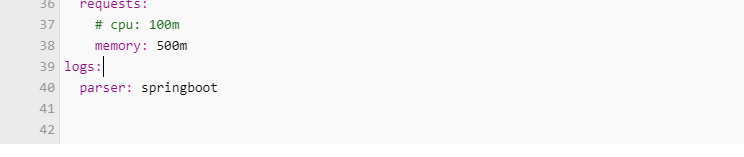
logs:
parser: spring-boot
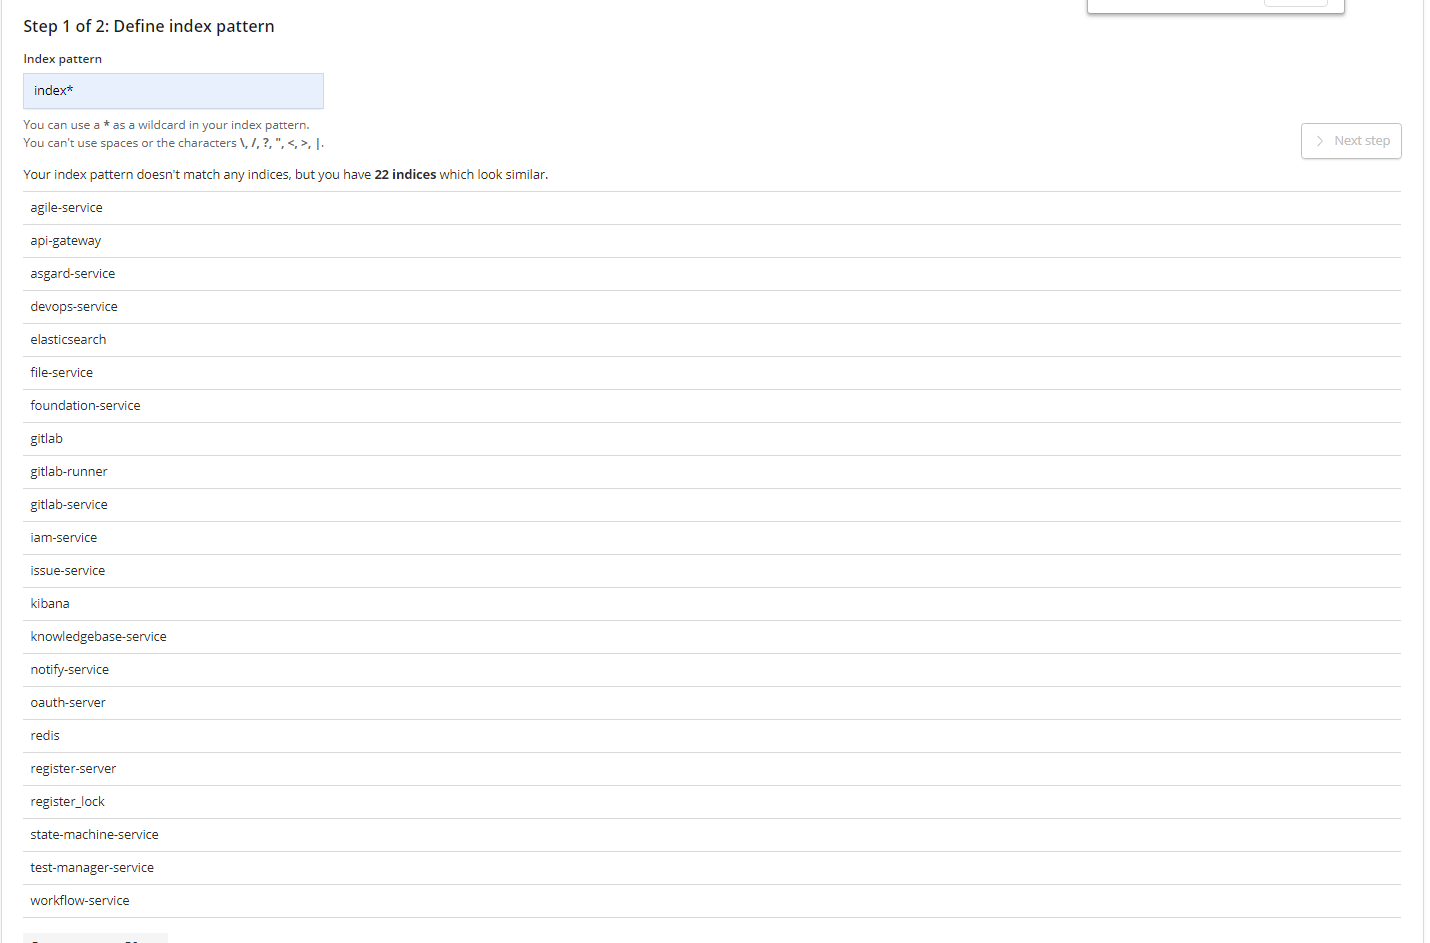
不知道是我哪里配置的不对,还是需要在配置什么,我现在kibana中的索引找不到我业务容器的日志
配置日志需要修改_helper.tpl、deplopment.yaml和values.yaml三个文件
_helper.tpl文件:
{{/* vim: set filetype=mustache: /}}
{{- /
service.labels.standard prints the standard service Helm labels.
The standard labels are frequently used in metadata.
*/ -}}
{{- define "service.microservice.labels" -}}
choerodon.io/version: {{ .Chart.Version | quote }}
choerodon.io/service: {{ .Chart.Name | quote }}
choerodon.io/metrics-port: {{ .Values.deployment.managementPort | quote }}
{{- end -}}

{{- define "service.labels.standard" -}}
choerodon.io/release: {{ .Release.Name | quote }}
{{- end -}}

{{- define "service.match.labels" -}}
choerodon.io/release: {{ .Release.Name | quote }}
{{- end -}}

{{- define "service.logging.deployment.label" -}}
choerodon.io/logs-parser: {{ .Values.logs.parser | quote }}
{{- end -}}

{{- define "service.monitoring.pod.annotations" -}}
choerodon.io/metrics-group: {{ .Values.metrics.group | quote }}
choerodon.io/metrics-path: {{ .Values.metrics.path | quote }}
{{- end -}}
deplopment.yaml文件:
apiVersion: apps/v1beta2
kind: Deployment
metadata:
name: {{ .Release.Name }}
labels:
{{ include “service.labels.standard” . | indent 4 }}
{{ include “service.logging.deployment.label” . | indent 4 }}
spec:
replicas: {{ .Values.replicaCount }}
selector:
matchLabels:
{{ include “service.labels.standard” . | indent 6 }}
template:
metadata:
labels:
{{ include “service.labels.standard” . | indent 8 }}
spec:
containers:
- name: {{ .Release.Name }}
image: “{{ .Values.image.repository }}:{{ .Chart.Version }}”
imagePullPolicy: {{ .Values.image.pullPolicy }}
env:
{{- range $name, $value := .Values.env.open }}
{{- if not (empty $value) }}
- name: {{ $name | quote }}
value: {{ $value | quote }}
{{- end }}
{{- end }}
ports:
- name: http
containerPort: {{ .Values.service.port }}
protocol: TCP
resources:
{{ toYaml .Values.resources | indent 12 }}
values.yaml
metrics:
path: /prometheus
group: docker
logs:
parser: docker
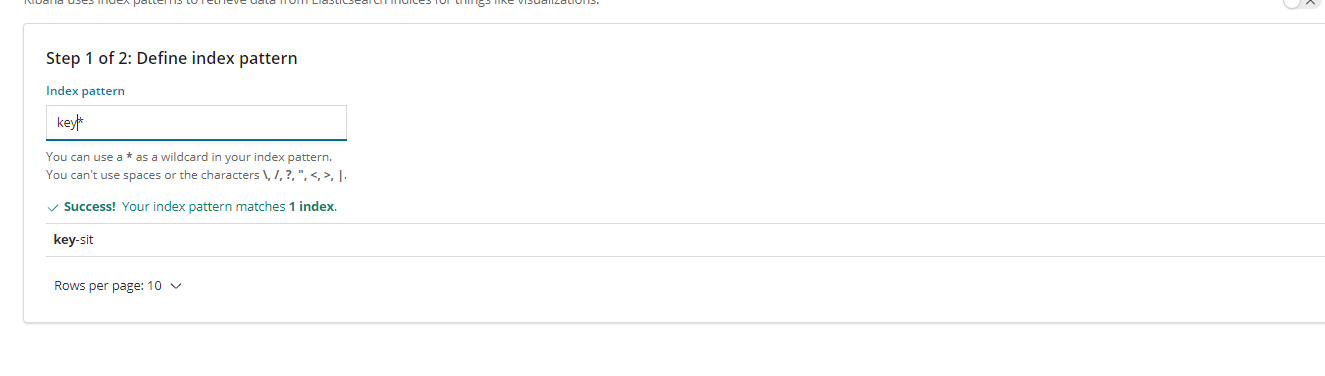
这样配置后,在kibana里边就会有业务容器的索引了